Explore & Refine the Model
The Model page is your interactive workspace. It shows the same data as Insights, but lets you dig in, edit, and run scenarios. The workspace is organized into panels you can open, close, and rearrange.
Panels overview
Pathways
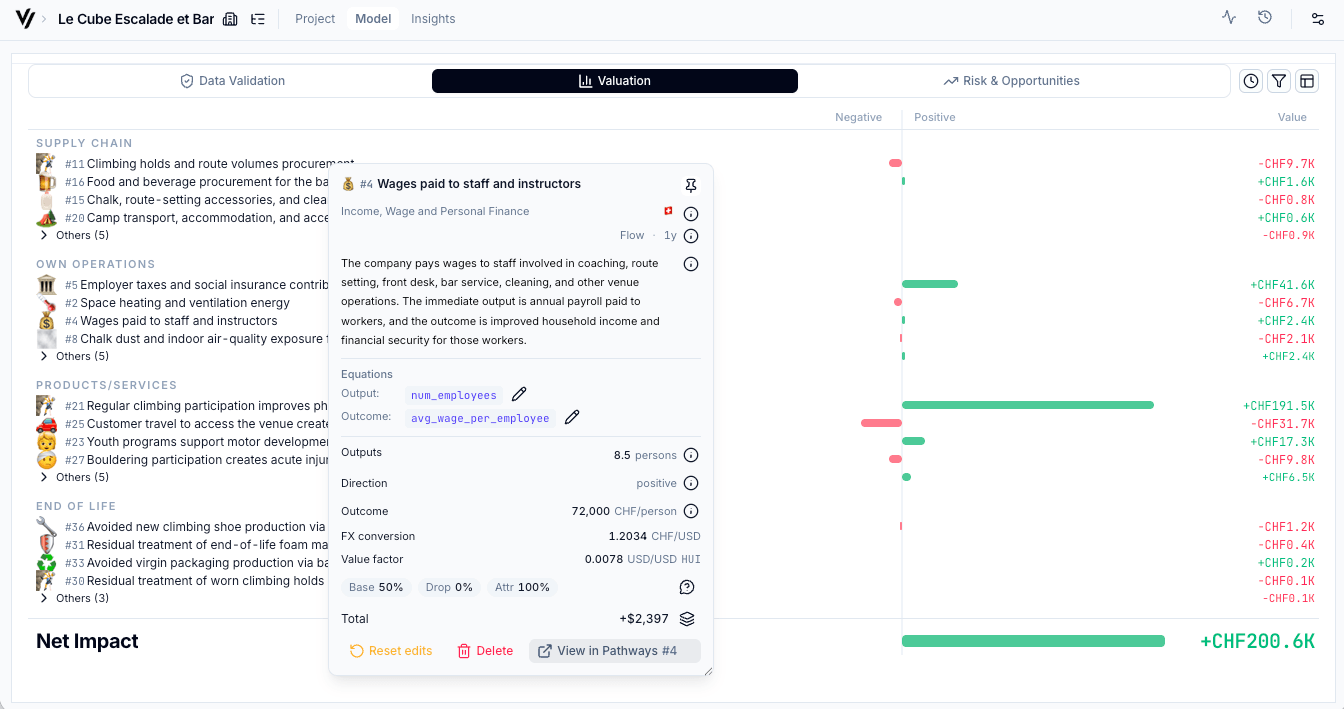
Lists every impact pathway the AI traced. Each pathway maps a business activity through an output to a monetized outcome. Click any pathway to see:
- The full decomposition (activity → output → outcome → valuation)
- Geographic weighting (where the impact occurs)
- Source citations and assumptions
- The equations driving the calculation
The pathway inspector supports direct editing for pathway details, so you can review and correct material assumptions without leaving the focused pathway view.
Variables
Shared assumptions that feed into multiple pathways — things like employee count, revenue, energy consumption. These are the levers of the model.
- Driver variables represent real-world inputs (e.g., "Number of users")
- Parameter variables are external reference values (e.g., "Social cost of carbon")
- Derived variables are calculated from equations linking other variables
AI Chat
An embedded assistant that understands your specific model. Use it to:
- Ask "why" questions ("Why is this pathway valued so high?")
- Request changes ("Set the employee count to 500 and recalculate")
- Explore implications ("What happens if we exclude the carbon offset pathway?")
Scenarios & Prediction agent
The Prediction agent generates editable scenarios that project how the company's impact scales over time. You can also create custom scenarios by modifying variables and pathway factors manually, adding columns for time steps, or describing your own growth assumptions in the AI Chat.
Useful for:
- Projecting impact at the scale you envision for an investment
- Sensitivity testing ("How much does the SROI change if revenue doubles?")
- Pre/post investment modeling ("What's the impact before vs after our growth capital?")
Scenario charts include baseline and projected bars. Click a bar to open the matching state in the main valuation timeline.
KPIs
Configure which metrics to surface for reporting. The KPI panel shows SROI and IMOIC calculations, and lets you select specific pathways or variables to highlight in external reports.
Citations
Every number in the model traces back to a source. The citations panel is your audit trail — it lists the data sources, methodologies, and assumptions behind each pathway and variable. Citation usage tracking shows where each source is used across the model, with links back to the related variables and pathways.
Org financials
Org financials live in a dedicated project tab. Use it to review or edit revenue, investment, valuation, and other financial inputs that affect SROI, IMOIC, and downstream valuation outputs.
Editing values
Click any editable value (highlighted when you hover) to modify it. The model recalculates in real-time. Your edits are tracked — you can see what changed from the AI's original output.
Cmd+Z / Cmd+Shift+Z (Mac) or Ctrl+Z / Ctrl+Y (Windows) to step through your edit history.Extracting KPIs for reporting
For LP disclosures (SFDR, CSRD) or internal reporting:
- Open the KPIs panel
- Select the pathways and metrics relevant to your reporting framework
- The values are ready to use — every number is traceable and defensible
Downloading data for advanced work
Use downloads when you need to work outside the app:
- Project ZIP - Download a project snapshot from the project controls.
- Workspace export - Download all projects in a workspace from the workspace menu.
- Excel workbooks - Use the per-project workbook for spreadsheet review and reporting.
- JSONL and schemas - Use the workspace export for Claude, Codex, notebooks, BI tools, custom visualizations, and portfolio analytics.
Workspace exports include baseline project data, scenario outputs, source rows, environmental KPI files, methodology notes, JSON schemas, and helper scripts.
Next steps
- Re-run analysis — If you've gathered new data from the investee, update your inputs and re-run to get a refreshed model
- Share results — The Insights page is designed to be shared directly with stakeholders
- Validate results — Use the Validation tab to confirm or flag the assumptions that matter most